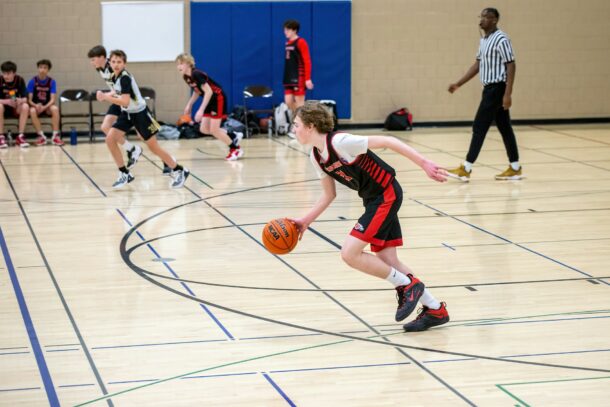
Good basketball defensive tracking stats help coaches move beyond guesses. A team may look active, loud and aggressive, but the real question is whether the defense is forcing the offense into the right spots.
Funnel Down makes that answer easier to find. The system is built around ball location. The ball is either in the gutter, in the alley or in the strike zone. Since those areas are easy to identify, coaches can chart the defense without expensive software or a full video staff.
That’s one reason Funnel Down works better than Lock Left as a base system for many youth and high school teams. Lock Left has useful ideas, but its success can depend on more layered reads. Funnel Down gives coaches simple tracking points from the first week of practice.
Why Basketball Defensive Tracking Stats Matter
Coaches often track points allowed, rebounds and turnovers. Those numbers matter, but they do not always explain why the defense succeeded or failed.
A team can allow fewer points because the opponent missed open shots, force turnovers because the opponent made careless passes, and win a game while still failing to execute the defensive plan.
Better basketball defensive tracking stats answer better questions.
- Did the ball stay out of the middle?
- Did the defense keep the ball in the gutter?
- Did the offense reach the strike zone?
- Did traps create turnovers, bad shots or rushed decisions?
- Did the defense finish possessions with stops?
Those answers help coaches fix the right problems.
Start With Gutter Percentage
Gutter percentage is the most important Funnel Down stat. This number shows how often the defense keeps the ball outside the volleyball lines for most of a half-court possession. Since Funnel Down is designed to shrink the playable court, gutter percentage shows whether the system is doing its job.
| Stat | What it measures | Strong target |
|---|---|---|
| Gutter percentage | Ball stays outside the volleyball lines for most of the possession | 60% or higher |
| Elite gutter percentage | High-level court control | 70% or higher |
| Middle drive rate | Ball gets into the alley or central paint | Under 12% |
| Strike zone entries | Ball reaches the short corner or deep baseline | 30% to 50% |
The report lists 50% to 70% as a general target range for Funnel Down gutter possession, with 70% or higher representing elite control. This stat gives coaches a clear weekly goal.
Instead of saying, “We need better defense,” the coach can say, “We need to raise our gutter percentage by 10 points this week.” Players understand that. Assistants can track it. Film can confirm it.
Track Middle Drive Rate
Middle drive rate shows how often the defense allows the ball into the most dangerous part of the floor. In Funnel Down, the middle is a problem. When the ball gets into the alley, the offense has cleaner passing angles and better finishing chances. Help defenders also have to cover more space.
The formula is simple: Middle drive rate = middle drive possessions / total half-court defensive possessions
A strong Funnel Down team should keep this number low, with under 10% considered strong and under 15% as acceptable for middle penetration. Middle drive rate can point directly to practice needs.
| Problem | Likely correction |
|---|---|
| Too many middle drives from the wing | Fix on-ball angle |
| Too many reversals into the middle | Improve the pin |
| Too many straight-line drives | Add earlier help |
| Too many paint touches from the top | Pressure the ball sooner |
This is where Funnel Down becomes highly coachable. The stat leads to the correction.

Measure Strike Zone Entries
The strike zone is where Funnel Down turns ball location into pressure. Once the ball reaches the short corner or deep baseline, the defense can trap. The sideline and baseline limit space, while the second defender closes the ball handler’s escape options.
Strike zone entries show whether the defense is sending the ball where it wants.
| Stat | Formula | What it shows |
|---|---|---|
| Strike zone entry rate | Strike zone entries / total half-court possessions | How often the defense creates trap chances |
| Trap conversion rate | Turnovers or bad shots / strike zone traps | How productive the trap is |
| Trap turnover rate | Trap turnovers / strike zone traps | How often the trap creates a direct turnover |
A trap does not have to create a steal to be successful. A rushed pass, forced timeout, contested floater or bad short-corner shot can still help the defense. Coaches should consider tracking trap conversion rate in Funnel Down and target of 40% or higher for strike zone turnover conversion.
Coaches should review trap clips in two groups: good traps and late traps. The difference usually shows up in foot angle, spacing and weak-side rotation.
Track Contested Shots
Turnovers are great, but a good defense also forces difficult shots. Funnel Down helps create those shots by pushing the ball away from the middle. Baseline drives often lead to worse angles, fewer passing options and more rushed finishes.
Coaches should chart whether opponent shots are contested or uncontested.
| Shot stat | What to track |
|---|---|
| Contested shot percentage | Defender within arm’s length on the release |
| Uncontested 3-point rate | Open threes allowed without a closeout |
| Drive field goal percentage allowed | Makes and attempts on drives |
| Rim field goal percentage allowed | Makes and attempts inside 4 feet |
The report recommends tracking contested shot percentage, uncontested three rate, opponent field goal percentage by zone and drive field goal percentage allowed.
This matters because some defensive possessions can look messy but still end well. If the opponent takes a contested baseline floater, the defense may have done its job. The goal is controlled pressure.
Use Simple Possession Codes
Coaches do not need a complicated stat sheet to track Funnel Down. A simple code system works.
| Code | Meaning |
|---|---|
| G-L | Ball in left gutter |
| G-R | Ball in right gutter |
| MID | Ball in the alley or middle |
| SZ | Strike zone entry |
| TRAP-TO | Trap created a turnover |
| TRAP-SS | Trap created a bad shot |
| TO | Forced turnover |
| DEFL | Deflection |
| 3-O | Uncontested 3-point attempt allowed |
| 3-C | Contested 3-point attempt |
| STOP | Possession ended without a score |
| SCORE | Opponent scored |
The report includes a similar charting template for defensive possessions, including gutter location, middle breakdowns, trap outcomes, contested threes, stops and scores. A manager can track these during the game. A coach can clean up the chart during film review.
The process does not need to be perfect at first. Consistent charting over several games will show useful trends.
Build a Weekly Defensive Dashboard
Once the team has basic charting in place, coaches can create a weekly defensive dashboard.
| KPI | Weekly target |
|---|---|
| Gutter percentage | 60% or higher |
| Ball reversal rate | Under 25% |
| Middle drive rate | Under 12% |
| Opponent turnover rate | 20% or higher |
| Steals per game | 8 or more |
| Deflections per game | 12 or more |
| Contested 3-point rate | 85% or higher |
| Drive field goal percentage allowed | Under 48% |
| Stop ratio | 55% or higher |
| Strike zone trap conversion | 40% or higher |
This dashboard helps coaches make better use of practice time. Low gutter percentage means the team needs more angle work. High middle drive rate means the pin is not strong enough. Low trap conversion means players may be trapping without proper spacing or rotation.
The dashboard turns film into a plan.
Why Funnel Down is Easier to Measure than Lock Left
Lock Left can work well, but it asks coaches to evaluate several connected actions. Did the on-ball defender force left, and did the wall defender get set? Did the free-side defender snipe the passing lane, and did the closeout take away the catch-and-shoot three? Those details matter, but they can be hard for young teams and volunteer staffs to chart consistently.
Funnel Down starts with one clear question: Where was the ball?
If the ball stayed in the gutter, the possession likely followed the plan. The defense broke down if the ball go to the alley. If the ball entered the strike zone, the defense created a trap chance. That clarity makes Funnel Down easier to teach and easier to prove.
Turn Stats Into Better Film Sessions
The best basketball defensive tracking stats should lead straight into film. Coaches can organize clips by category:
| Film category | Coaching focus |
|---|---|
| Gutter wins | Reinforce strong pin and funnel angles |
| Middle breakdowns | Correct stance, positioning and help timing |
| Strike zone traps | Review trap spacing and rotations |
| Open threes allowed | Fix weak-side recovery |
| Stops | Show players what a winning possession looks like |
Players learn faster when film connects to the same language they hear in practice. Funnel Down makes that connection easy. The court landmarks are the teaching points. The stats are the proof.
Final Thoughts on Basketball Defensive Tracking Stats
Basketball defensive tracking stats give coaches a clearer way to evaluate Funnel Down defense.
Gutter percentage shows whether the team is shrinking the court. Middle drive rate shows whether the defense is protecting the alley. Strike zone entries and trap conversion rate show whether pressure is turning into results. Contested shot percentage and stop ratio show whether the team is finishing possessions.
Lock Left can be a useful advanced layer, especially for teams that want to attack a specific ball handler’s weak hand. Funnel Down is the better base for most youth and high school teams because coaches can teach it quickly, chart it clearly and improve it week by week.
When players know where the ball should go and coaches can prove whether it got there, the defense becomes easier to trust.

Latest Posts
- Closeout drill: How to teach players to close out without getting beat
- How do I start coaching basketball with no experience?
- First basketball practice: 7 ways to set the tone on day one
- Youth basketball tryouts: 7 ways to evaluate players more effectively
- 3 on 2 shooting drill: Build better reads, ball movement and shot selection